Home > Blog
Read Time — 5 minutes
The Manufacturer’s Problem Solving Toolkit Part 4: Problem Solving Cause & Effect

One of the most popular and widely used problem-solving tools available is the cause and effect (C & E) diagram. Developed by Dr. Kaoru Ishikawa, a noted Japanese consultant and author of [2] A Guide to Quality Control, these diagrams have been used successfully by teams around the world. Sometimes referred to as an Ishikawa diagram, it is also referred to as a “fishbone diagram” because its basic structure resembles the skeleton of a fish. Whatever you wish to tall it, a C & E diagram is a useful tool that must be part of the problem-solver’s tool kit.
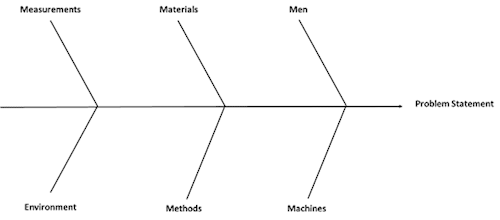
The figure below is the basic structure of the cause and effect diagram which is used to develop and organize potential causes of a problem. The potential causes are listed on the fishbones driving toward the problem (i.e. the effect). The effect or problem statement is stated to the right while the potential causes are listed as “fishbones” to the left under the appropriate category headings. By arranging lists in this manner, there is often a greater understanding of the problem and possible contributing factors.
Typical C & E diagrams are constructed with four major categories of potential causes (4 M’s: man, method, materials and machines), but the C & E diagram should be customized to the needs of the user. In other words, other categories can be added to further organize the potential causes. In our example, two other categories, environment and measurement have been added.

The following are the steps used to create a C & E diagram:
- Develop a statement of the problem which describes the problem in terms of what it is, where it is occurring, when it is occurring, and how extensive it is. This statement is the effect and is listed to the right on the C & E diagram.
- Brainstorm and create a list of causal categories that will be used to develop the possible causes of the problem on the C & E diagram. For example, if the problem being studied was equipment related, our categories might be listed as electrical, mechanical, pneumatic, man, methods, and materials. The team must be creative when selecting the causal categories.
- Construct the C & E diagram by:
a. Placing the problem statement to the right of the fishbones
b. Listing the causal categories above and below the centerline or “spine” of the fishbone diagram.
c. Brainstorm and list possible causes on the fishbones under the appropriate causal category heading. - Interpret the C & E diagram by:
a. Looking for causes listed in the individual fishbones and testing the potential causes to determine if they have an impact on the effect.
b. Gather additional data and information to validate the potential causes.
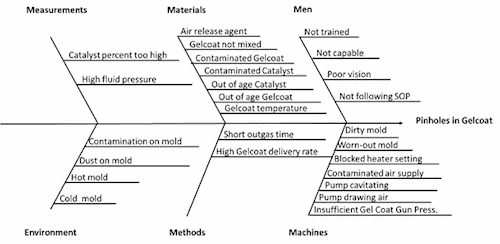
Let’s now look at an example of a real C & E diagram. Below, a team was attempting to solve a pinhole problem on a fiberglass part. Although the team had developed a more comprehensive problem statement, they simply stated the problem as “pinholes in gelcoat,” and then brainstormed to develop a list of potential causes.
One-by-one they tested the list of potential causes and narrowed it down to two possibilities, either contaminated gelcoat or contaminated catalyst. The replace both ingredients and the problem was solved. Remember, like all problem-solving tools, the C & E diagram will only identify potential causes. Only data and other information about the other causes will lead you to the actual root cause(s).

Causal chains enable sequencing to lead to root causes
When problems are discovered and investigated, a chain of events usually leads to the source or root cause. One of the most effective techniques for uncovering the root cause is the causal chain (aka chain of causality). Causal chains are stepwise evolutions of problem causes. They are typically seen in one of two chain-like patterns: steps or sawtooth.
Each step (or sawtooth) represents an object in a normal or abnormal state. The object is placed above the step-line and its state is placed below the line, directly underneath the object. Examples of objects and states include:
- Fuel Line Plugged
- Circuit Breaker Tripped
- Tire Flat
- Motor Stopped
Each step down is the effect of the preceding step and the cause of the next step down. That is, the information on the step to the left is always the cause of the information on the step to the right. The diagram starts with the problem.
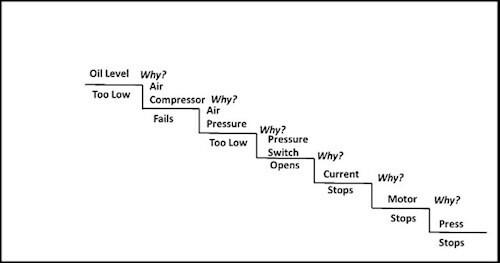
In the example below, a punch press has stopped. It then continues in a stepwise fashion, as the question “Why?” is asked for each effect.

An investigation reveals that a pressure switch had tripped the circuit breaker to the electric motor powering the press. In this example, we started with the problem symptom—the stoppage of the punch press—and continued in a stepwise direction to the left by asking “Why?” until we arrived at the root cause of the problem.
In a list format, the sequence was as follows:
- The punch press stopped because the motor stopped.
- The motor stopped because the current stopped.
- The current stopped because the pressure switch was open.
- The pressure switch opened because the air pressure was too low.
- The air pressure was too low because the air compressor failed.
- The air compressor failed because the oil level was too low.
In six steps, we found that the root cause of the press stoppage was ultimately a low oil level supplying the compressor.
Problem solving is a skill and with continued learning and training, you'll move beyond treating the symptoms of a problem and how to expose and address the underlying cause.
See how ECI's Cloud ERP Systems can help solve common business problems.
[1] Sproull, Robert F., Process Problem Solving – A Guide for Maintenance and Operation’s Teams, 2001, Productivity Press
[2] Ishikawa, Kaoru, Guide to Quality Control, 1986, Asia Productivity Organization


